"Failing to plan is planning to fail."

I trade only a few setups. As with many things, I find that its best to do a few things but to do them well. When I depart from those setup, I usually wind up with losses. The following are the few setups that I am currently trading, which have proven to be profitable.
- Continuation Anticipation.
Criteria 1. Stock must be a strong performer.
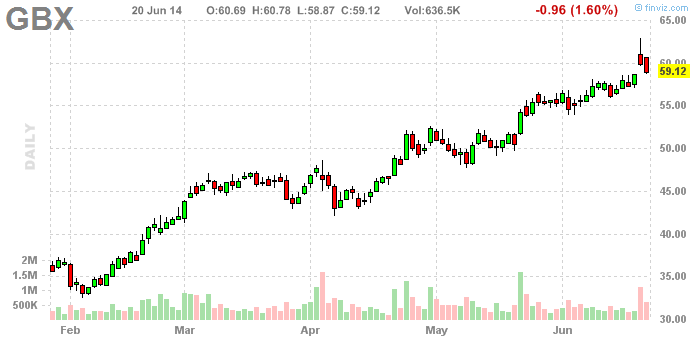
As I review, my trade journal for my prior use of this setup, I come across GBX. GBX had a nice trending moves going into consolidationwhere it got "tight." The majority of the time this pattern indicates that there is more to the upside and GBX was no exception
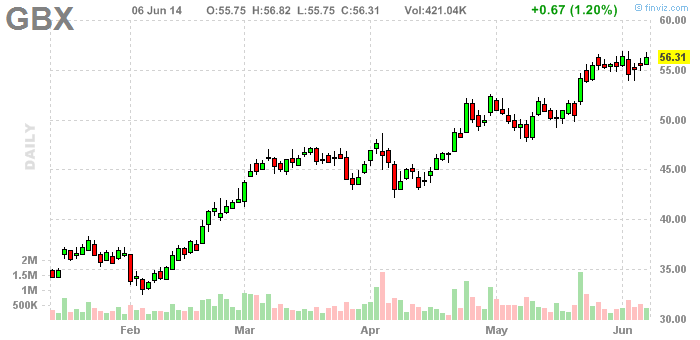
Stop Loss Placement: Because the entry in this setup is at a time where the momentum has temporarily left it is susceptible to a lot of shake outs for that reason the stop should be placed a the level where you are clearly wrong.
Position size: The position size for this setup tend to be smaller due to the wider placement of stop loss.
Profit taking: These are the stocks that can continue to run and once the momentum resumes a trend following strategy can be used. I typically use an Elder Impulse signal.
Gaps: since they have been running I'm skeptical of gaps. A gap in my favor that showed signs of fading would be a reason to take profits. That's what happened in GBX. The gap filled and I gave back $$ on this particular trade but due to the entry provided by the b/o anticipation I still wound up with a profitable trade. This particular gap filled completely and I would have had a loss had I not taken action.
- Momentum Burst
This is a setup that I employed with moderate success but I did not truly understand it until I joined Stockbee. This setup is designed to take advantage of the tendency for stocks to move in 3 to 5 day momentum bursts. It looks for a low risk entry in stocks that have had momentum behind them and can capitalize on a low risk entry, which allows you to increase position size. The buy point is as it breaks its range. It looks for a 3-5 move. Although with general market conditions dictate, I may sell on the first sign of weakness.
VDSI gets a 4%+ move out of a period of consolidation, which is the tell that the breakout is coming. Since the range was tight, decent size can be put on the trade.
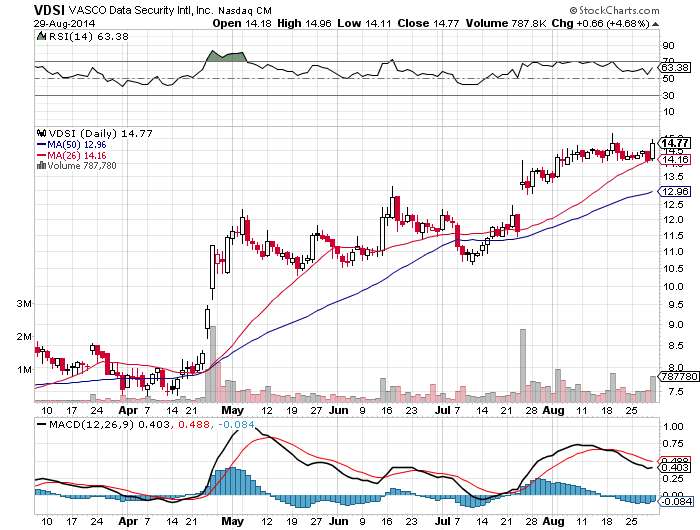
Stop: Usually, LOD of Breakout day.
Profit taking: 1 day rip of over 10%, momentum begins to fade, or at day 5 in good market, day 3 in mediocre markets.
This setup looks similar to the continuation anticipation setup. The difference for is in how I scan for candidates. For the anticipation continuation setup, I scan for stocks I know with good fundamentals. The Momentum Burst does not require the same scrutiny. I scan for for stocks in a strong uptrend. Look for consolidation on the charts and then buy if they breakout from their range.
The downside of this setup is that the win rate is not especially high since its is either a "do or die" type of trade. If it does not go right away, it get stopped.
- The Fishhook
The fishhook searches for super momentum stocks. These are stocks that have mega move on day one that catches everyone's attention. I want to see that move tested and then resume to the upside.
TREE
Criteria: Look for low float stocks with huge moves. Then track them.
Entry: above the entry of the day(s) the initial move was tested. The pull back should hold the 4EMA and the stock must breakout within a weak.
Profit taking: Don't push your luck. Any big move should be sold into.
- Episodic Pivot
Because these types of stocks have a game changer they will often run for quarters at a time. They are preceded by a big gap, which is the best entry if you can get it.
They may present a secondary entry to set up. So If I miss the first move, I'll wait for the first good setup. At that time, the continuation setup may be used.
- Mean Reversion
This set up involves a stock that falls a high %. What I am looking for is a washout type move and buyers start to come back in . The time to buy is after it starts to bounce. I am leery of midday bounces as they are unreliable. The reversal move should occur within the last hour of the trading day. That would be the time to buy. It also works best after the entire market has sold off hard.

STOP: A stop would be placed at the LOD.
Profit taking: Depending on the stock, I may get an entry where I can hold for months and the trend would resume or it may require a 1 day exit. In other words, "When a stock doesn't act as it should, quit. Don't argue with the tape... Quit while the quitting is good and cheap.” J. Livermore
- Weak Tops

SLCA:
I shorted SLCA here as it made another run to a high but MACD and volume did not follow. My short turned out to be .30 from the high:

And lead to this water fallL

Long Chart Rules
- stock in play with close above the 4EMA and RSI>70 on the 12 month daily
- Stop loss is the 4EMA
- low float stocks or in bad markets will look at 9EMA
- if stock drops below 4EMA intraday and it is thought to not recover – may sell but general rule is the close
- one close slightly below the 4EMA can be allowed if quality of story is strong
- When stock spikes above the 4EMA take 50%-100% off
- when 12 month daily criteria are met
- Historical monthly RSI>70 think of as engine (only tells strength behind move)
- Two year weekly RSI>70 think of as fuel (only tells strength behind move)
- When all three are lined up it can be some of the strongest moves
- 12 month daily is what i use to make trade decision
2-3 Day Rest Pattern
- stock has spiked or moved up with closes above 4EMA and RSI>70
- stock pulls back for 2-3 days usually on lower volume but closes above 4EMA and RSI stays >70
- Many times a stock will continue to move after 2-3 days of rest while still holding the chart criteria
- 4EMA would be stop loss and target would be near or above recent high
- When stock spikes above the 4EMA take 50-100% off
Slow Stochastics 20 Pattern
- only applies to former quality chart movers
- stock loses 4EMA and RSI<70 and stock pulls back over days or weeks
- No apparent specific stock news to cause the pullback. Market may be weak but no specific news to that shirt
- When stock reclaims the 4EMA it is in play again. RSI is not taken into account here
- 4EMA becomes the stop loss
Found your blog from learning to better my trades. Great content and super helpful. Thank you 🙏
ReplyDelete